Create Your First Project
Start adding your projects to your portfolio. Click on "Manage Projects" to get started
Full Analytics Pipeline: From raw data to valuable insights
A self-driven analytics project that explores campaign performance from raw data to final insights — built using SQL, Python, and Tableau.
The Context
This project analyzes 1,000 paid ad campaigns across platforms like Facebook, Google, Instagram, and LinkedIn. Each campaign includes performance metrics, demographic targeting, content format, and calculated KPIs like ROAS and CPA.
The goal was to simulate a real-world PPC (pay-per-click) environment, using structured data to identify trends, optimize spend, and guide smarter marketing decisions.
Key Columns in the Dataset:
Platform — Facebook, Google, Instagram, etc.
Content_Type — Video, Image, Text, or Carousel
Spend, Revenue, Budget — Campaign cost & earnings
Clicks, Impressions, Conversions — Ad funnel metrics
ROAS, CPA, CTR, Conversion_Rate — Core performance indicators
Target_Age, Target_Gender, Region — Demographics
Duration, Date — Campaign timing
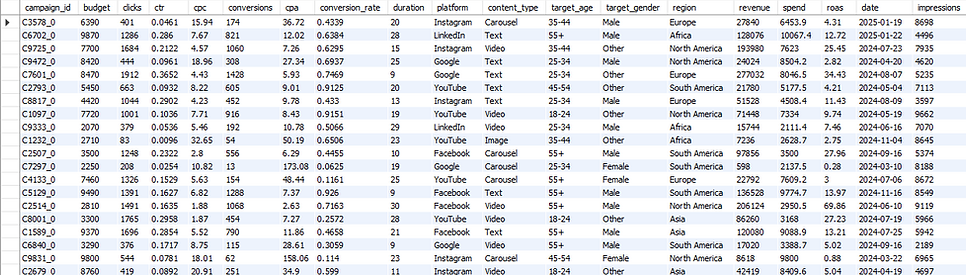
Cleaned Dataset Snapshot (Click image to expand):
The Question
Digital marketing spend is growing, but not all campaigns deliver. Using a synthetic dataset modeled after real-world campaigns, this project explores which platforms, content types, and audience segments would drive the highest return on ad spend (ROAS).
The goal: simulate a real analytics workflow that helps teams make smarter, data-backed decisions.
The Process
1. Data Import & Exploration
Started with a raw campaign dataset in CSV format. Previewed structure and checked for missing values.
2. Cleaning in Python
Used Pandas to clean the dataset, handle missing values, remove duplicates, and standardize column names to prepare for SQL analysis.
3. Export & SQL Setup
Saved the cleaned dataset and imported it into MySQL for structured querying.
4. Custom SQL Queries
Wrote 7 queries to explore ROAS, platform performance, content type impact, and demographic trends.
5. Visualization in Tableau
Exported query results and visualized them in Tableau Public. Built 4 dashboards aligned to key business questions, such as platform ROI and audience targeting.
Key Insights From SQL Analysis
These insights were derived from seven custom SQL queries built on cleaned PPC campaign data. Each query was written with intention to simulate real analyst work in a performance marketing environment.
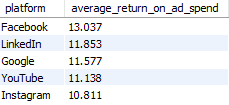
Insight 1: Facebook had the highest average ROAS
Facebook delivered an average ROAS of 13.04, followed closely by LinkedIn and Google. All platforms are significantly above the standard ROAS benchmark of 4.0, indicating strong returns across all platforms.
Recommendation:
Prioritize Facebook for scaling campaigns. All platforms performed exceedingly well - no major changes are required but prioritizing top three platforms could improve returns.
SQL Query 1

Query 1 Output


Final Reflection
This project was developed to evaluate digital ad performance through a complete, end-to-end analytics workflow. Beginning with raw campaign data, I designed and executed the full process, including data cleaning in Python, structured querying in MySQL, and visual analysis using Tableau dashboards.
The findings provided clear strategic insights:
-
Facebook campaigns achieved the highest ROAS across platforms
-
Video-based content consistently outperformed all other formats in conversion rate
-
The 25–34 and 55+ age groups were the most cost-efficient
-
Nearly 130 campaigns spent over $7,500 and returned less than 4.0 ROAS, exposing major inefficiencies
Every part of this project, from the data cleaning to the dashboard design to this website, was built independently with lots of care.
My goal with this project was to learn, build, and demonstrate my ability to manage a full analytics pipeline and produce results that are both technically sound and built for real business use.